Warning
Zyte API is replacing Smart Proxy Manager. It is no longer possible to sign up to Smart Proxy Manager. If you are an existing Smart Proxy Manager user, see Migrating from Smart Proxy Manager to Zyte API.
Zyte Smart Proxy Manager Usage & Recent Requests
Usage Stats
Zyte Smart Proxy Manager User Stats dashboard provides better visibility and customization for your Smart Proxy Manager stats monitoring.
Datasets
The following dataset can be accessed for your Zyte Smart Proxy Manager account.
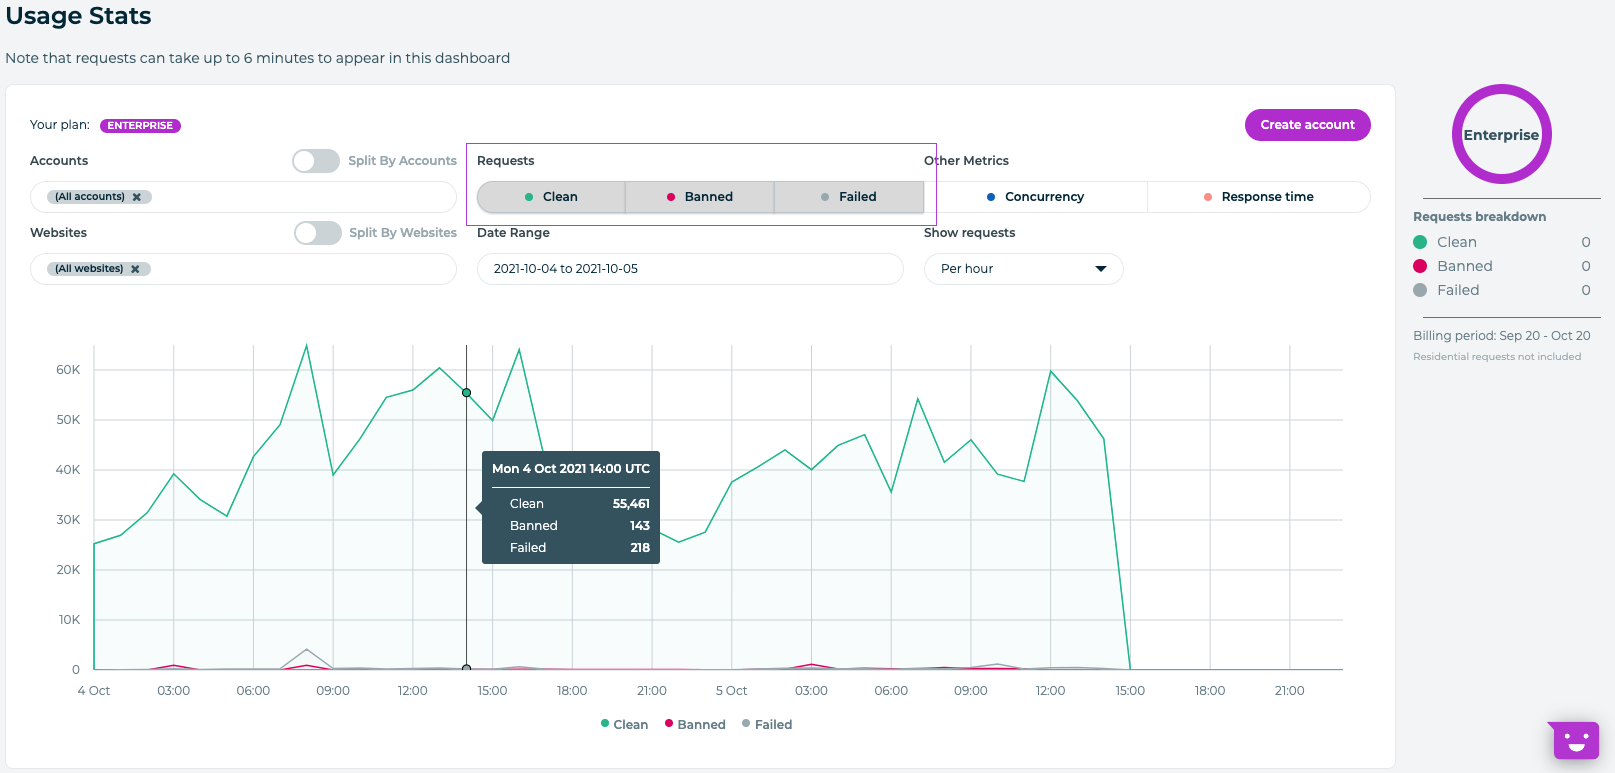
Requests
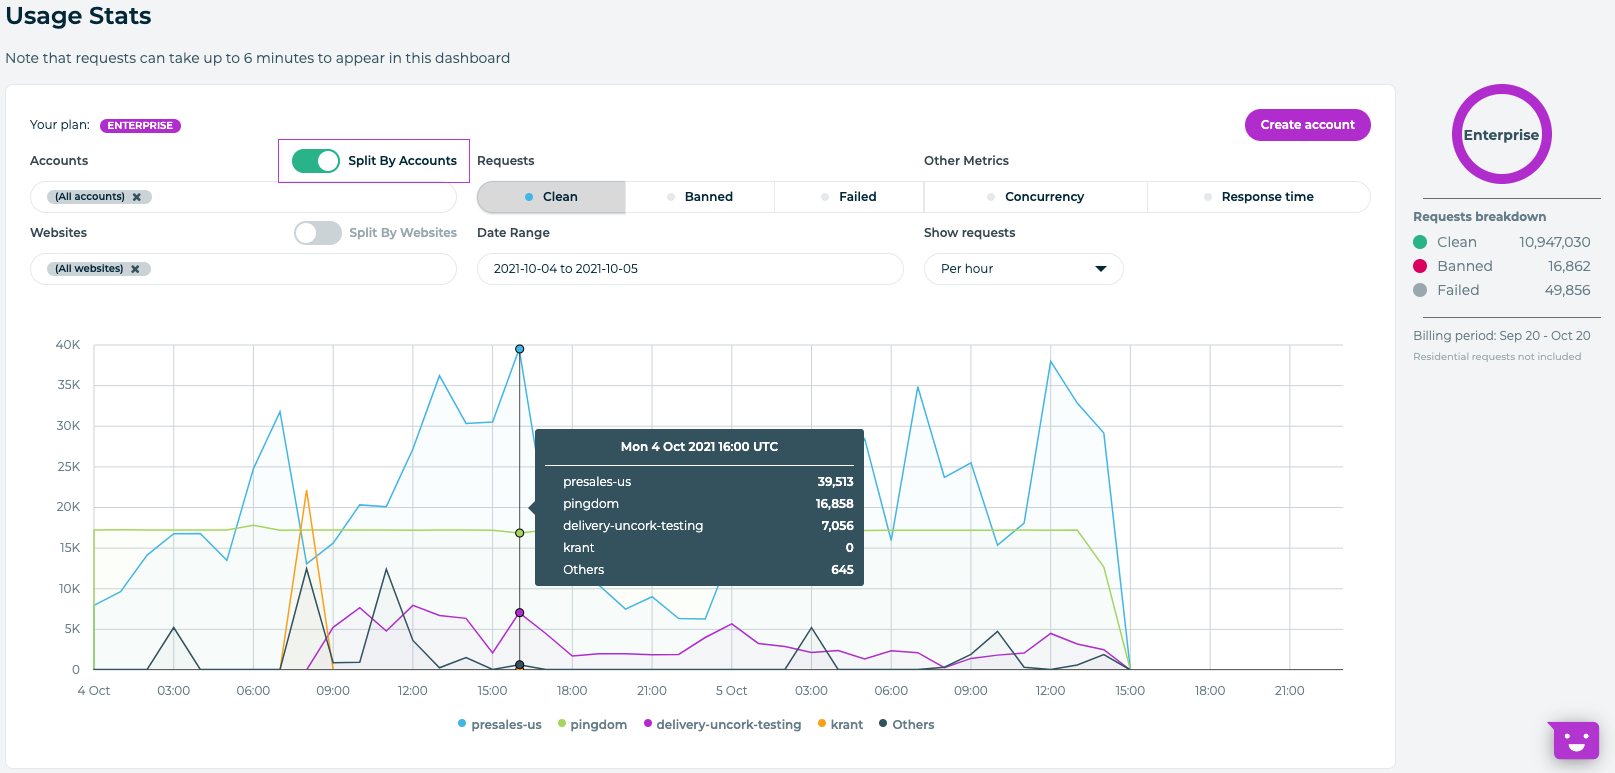
This is the default view for the Usage Stats dashboard. It shows you a distribution of clean, banned, and failed requests. Clean requests count towards your quota, banned and failed requests don’t. Check out Errors Reference for more information about failed requests and related HTTP error codes.
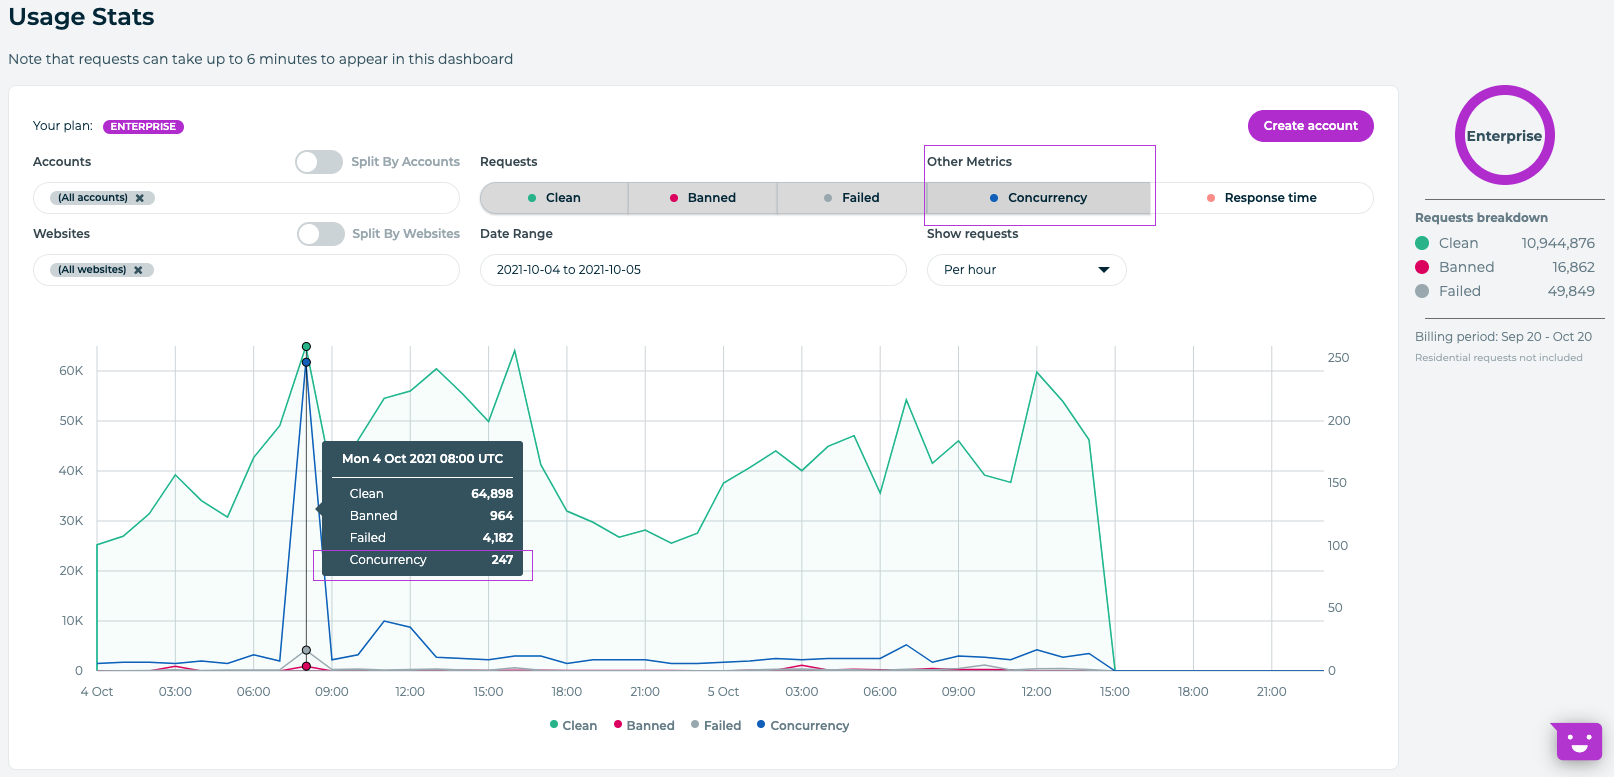
Concurrency
The concurrency graph shows you how many concurrent requests you are making so you can keep it in line with your current plan’s limit.
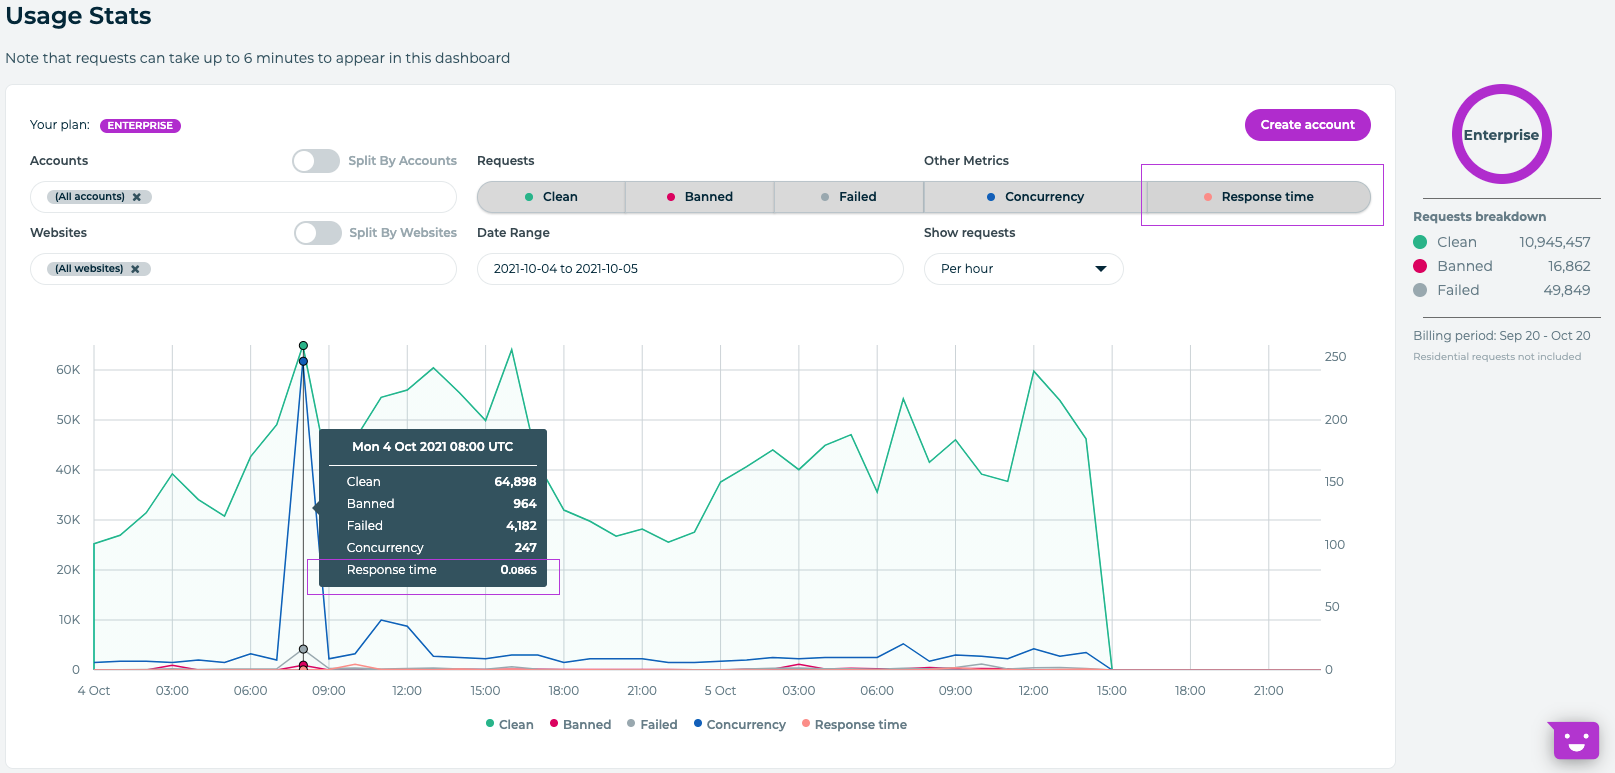
Response time
The response time graph shows you the average response time in seconds of your requests for the selected accounts.
Graph customization
Splitting by Account
Splitting by account will show 5 results that can be in either way described below
The top 4 accounts with the most usage + remaining accounts combined.
If you have less than 5 Smart Proxy Manager accounts, you will only see those. You can also select specific accounts.
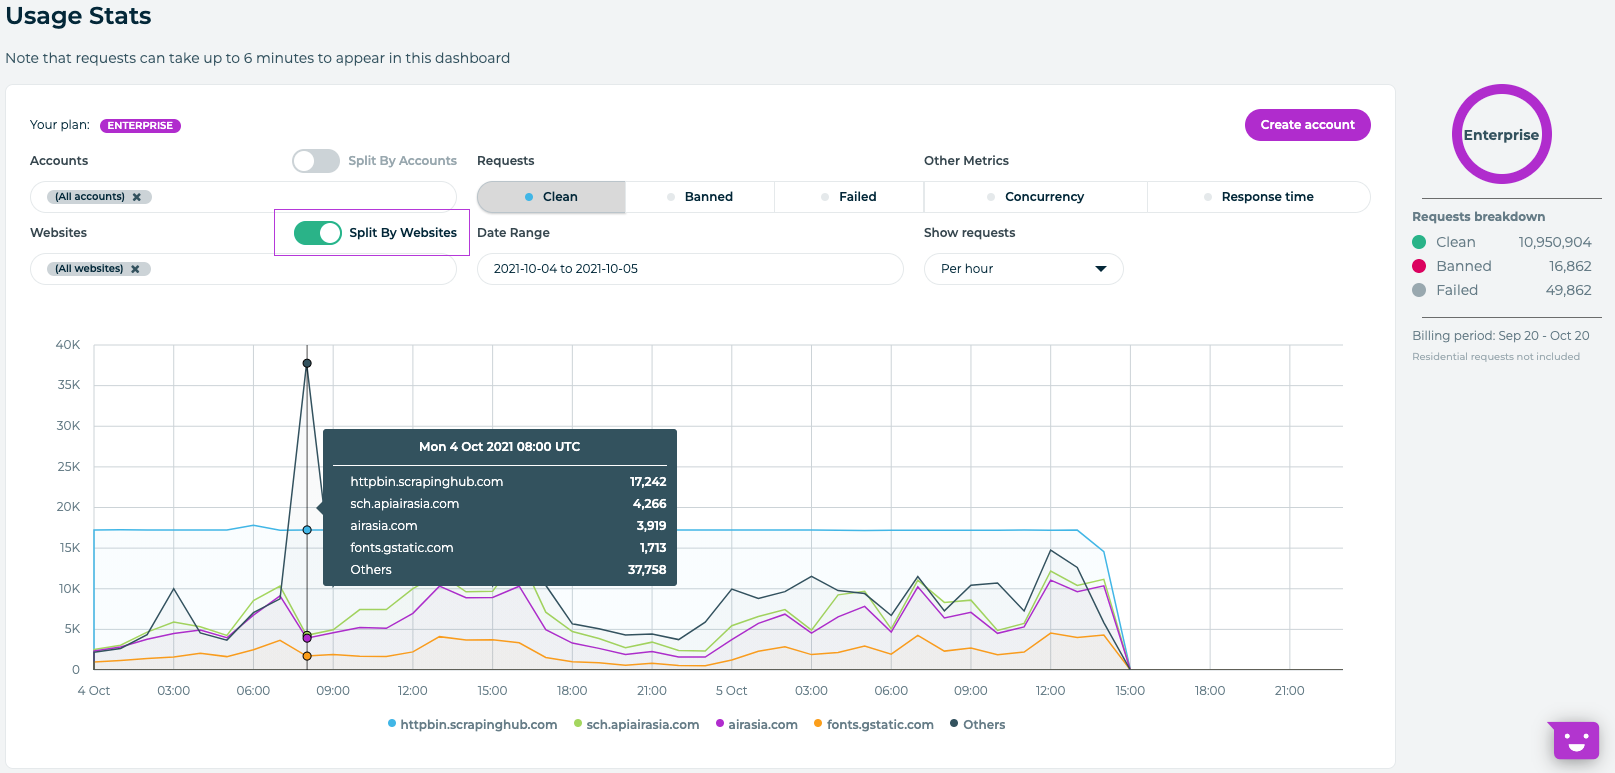
Splitting by Website
Splitting by website will show you at max 5 websites.
By default, the 5 most requested websites will be shown on the graph.
If you select more than 5 websites, the first 4 entries on the graph are websites with the most requests and the 5th entry is the combination of the rest of the websites selected labelled as
Others.
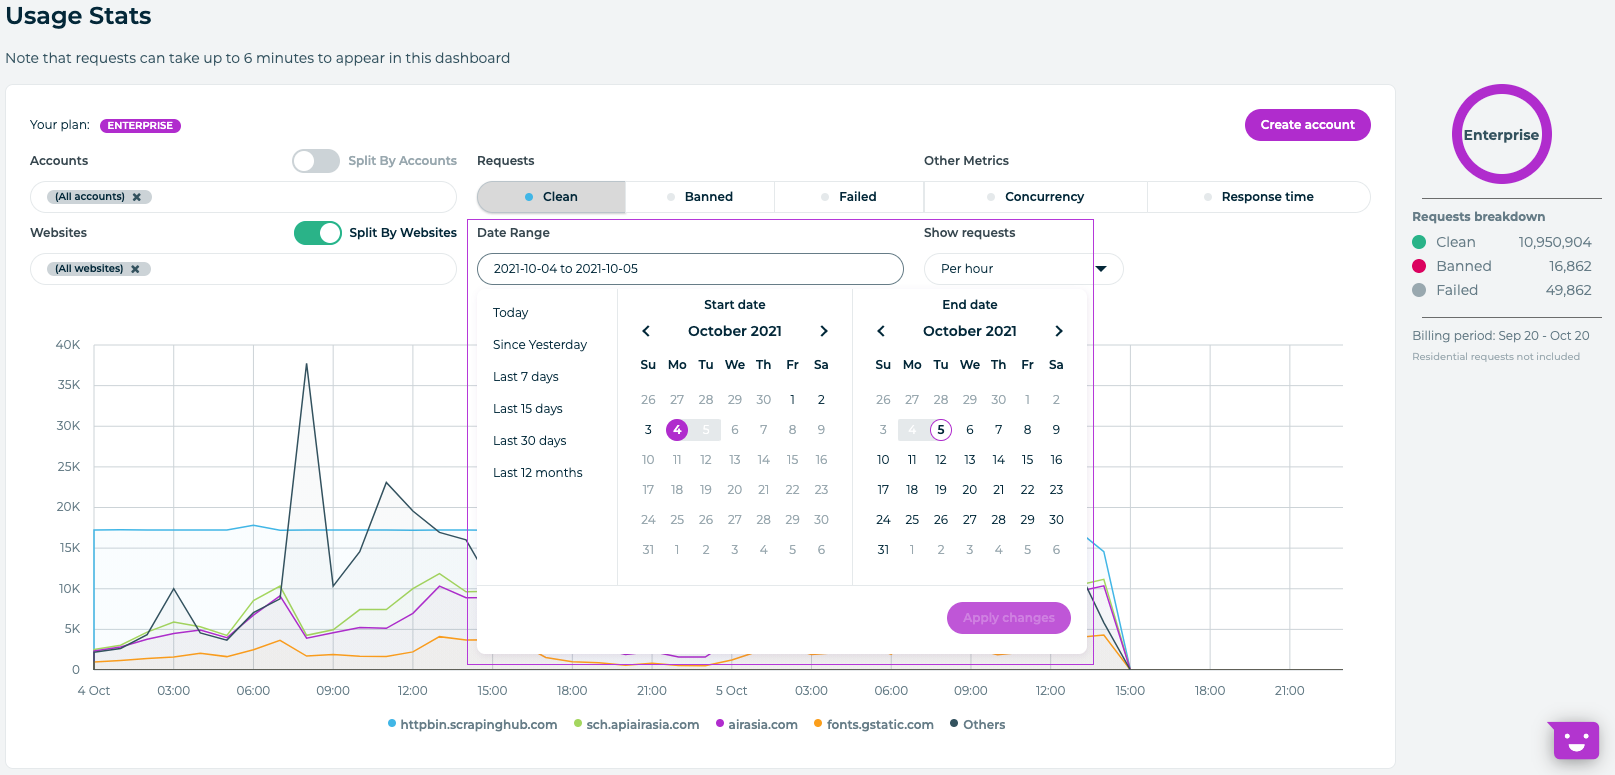
Adjusting Date Range
You can now select a date range to plot your graph up to 1 year. You can also change the
intervals in which the graph is displayed: per hour, per day, or per month. Note that if
you are loading 1 day of data then it doesn’t make sense to set the interval to per month.
Please note that the more data you load the longer it will take for the graph to load.
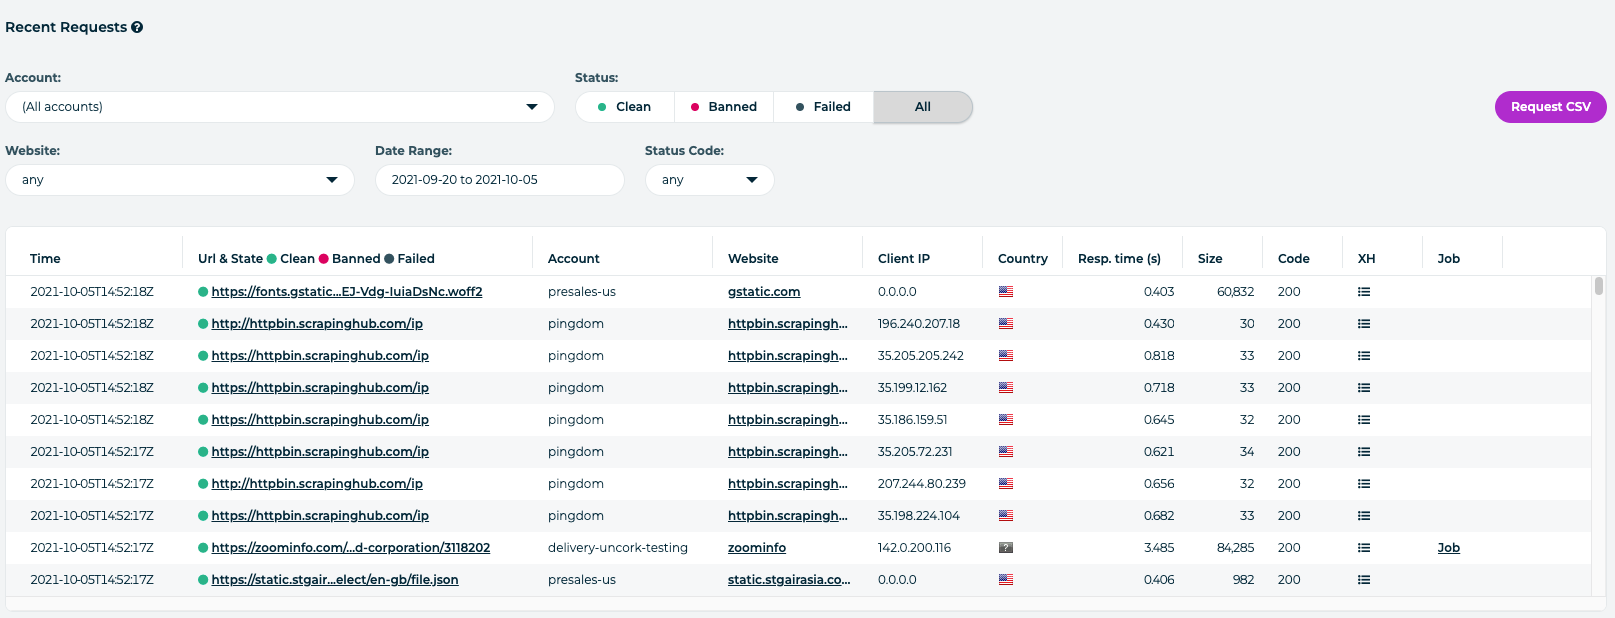
Recent Requests
The recent request currently has 14 days history. You can now filter per user from a dropdown menu which also shows you the country (or countries) that your user is assigned to.
The recent requests can be filtered by Status:
Clean/Banned/Failedor All.You can also download a list of the last 5000 requests done in the last 2 weeks as a CSV file.