Zyte API stats API
Tip
For the reference documentation of the HTTP API of Zyte API itself, see Zyte API reference documentation.
The Zyte dashboard has a Stats page that lets you monitor different aspects of your Zyte API requests, including cost, response time, or features used.
Zyte API also offers an HTTP API to query your Zyte API requests.
Authentication
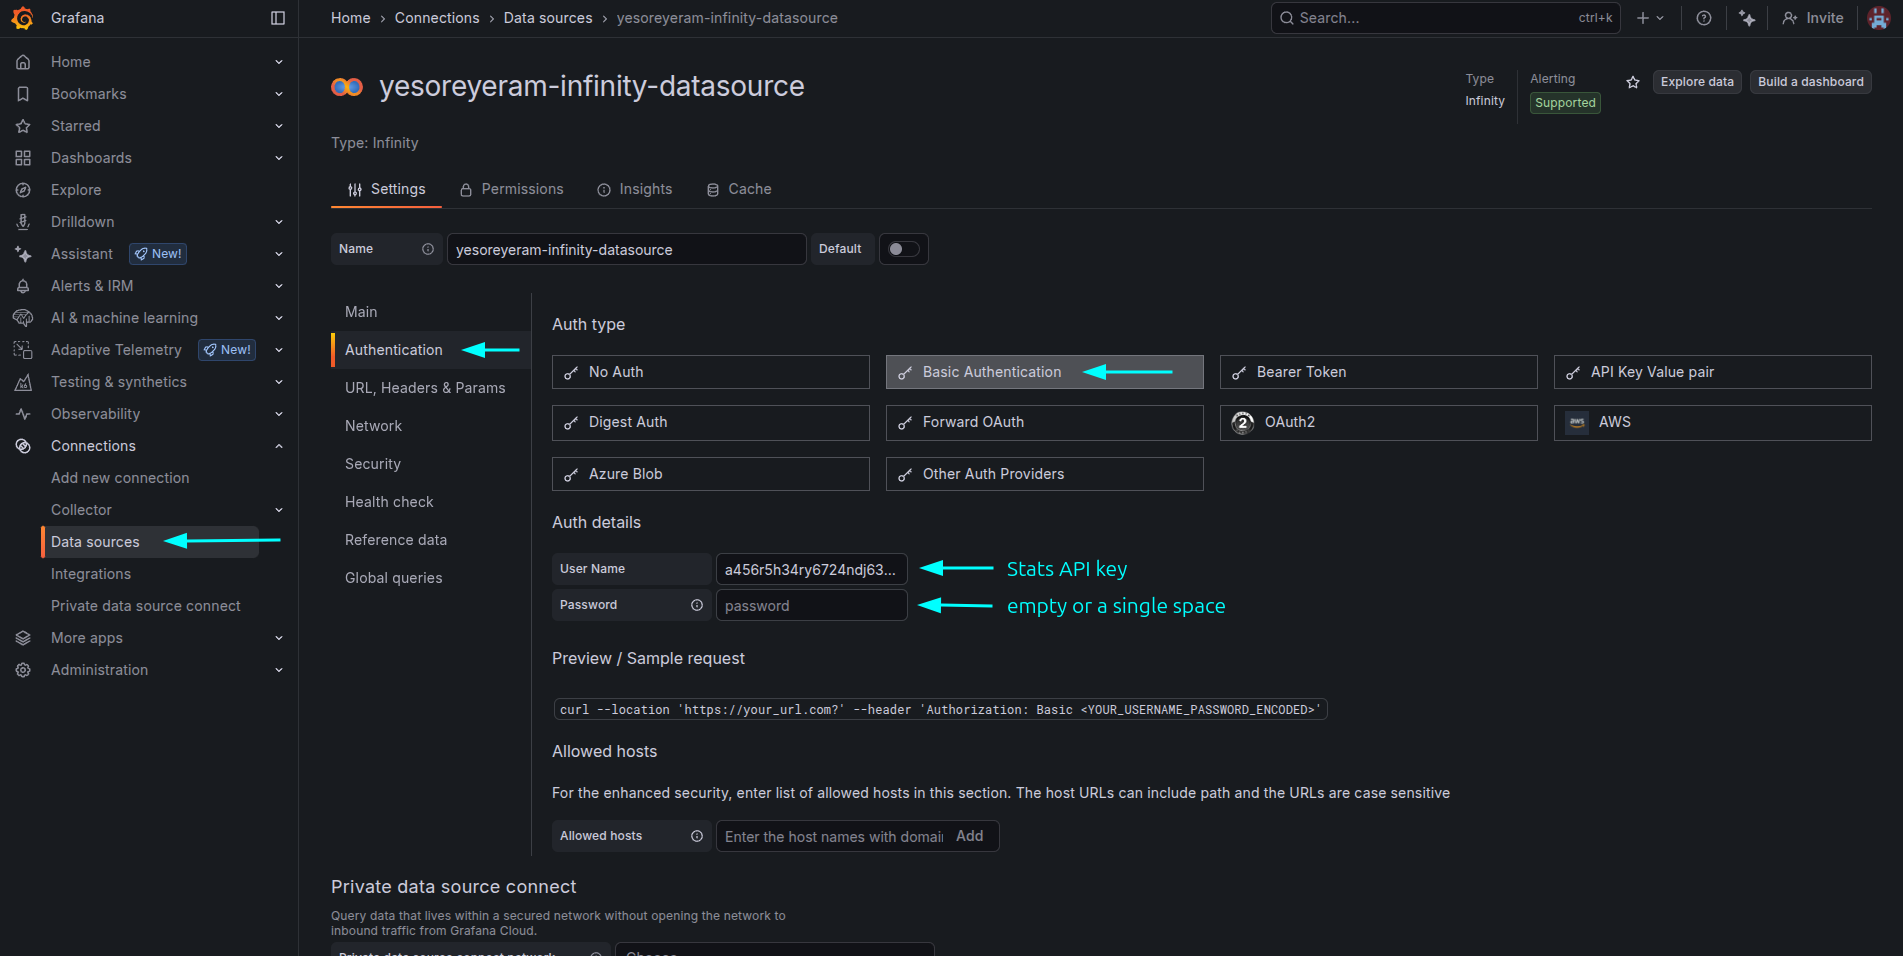
All requests require basic authentication, with your Zyte dashboard API
key (not your Zyte API key) as username, and no password. For example, if
your API key is foo, you base64-encode foo: as Zm9vOg== and send
the Authorization header with value Basic Zm9vOg==.
Authorization: Basic Zm9vOg==
Basic usage
The most basic request only requires an organization ID.
To find your organization ID, open the Zyte dashboard and
copy your organization ID from the browser address bar.
For example, if the URL is https://app.zyte.com/o/000000,
000000 is your organization ID.
curl \
    --user YOUR_STATS_API_KEY: \
    --compressed \
    https://zyte-api-stats.zyte.com/api/stats?organization_id=000000
{
    "page": 1,
    "page_size": 500,
    "results": [
        {
            "billed_traffic_bytes": 0,
            "cost_microusd_avg": "1335.10",
            "cost_microusd_p80": "2040.00",
            "cost_microusd_total": "584773.00",
            "organization_id": 000000,
            "request_count": 438,
            "response_time_sec_avg": "5.49",
            "response_time_sec_p80": "6.40",
            "status_codes": [
                {
                    "code": null,
                    "count": 3
                },
                {
                    "code": 200,
                    "count": 432
                },
                {
                    "code": 404,
                    "count": 3
                }
            ]
        }
    ],
    "total_result_count": 1
}
Note
This endpoint reports costs in US dollars only, through the
cost_microusd_* fields. If your organization is billed in a different
currency, use the multicurrency endpoint
instead; /api/stats rejects non-USD organizations.
Multicurrency
The /api/v1/stats endpoint works like /api/stats but reports costs per
currency. Use it if your organization is billed in a currency other than US
dollars.
It accepts the same parameters as /api/stats. In each result, the scalar
cost_microusd_* fields are replaced by cost_micro_* arrays with one entry
per currency present in your usage. As with /api/stats, each result also
includes a billed_traffic_bytes field.
curl \
    --user YOUR_STATS_API_KEY: \
    --compressed \
    https://zyte-api-stats.zyte.com/api/v1/stats?organization_id=000000
{
    "page": 1,
    "page_size": 500,
    "results": [
        {
            "organization_id": 000000,
            "request_count": 438,
            "billed_traffic_bytes": 0,
            "cost_micro_total": [
                {"currency": "USD", "value": 584773},
                {"currency": "EUR", "value": 538791}
            ],
            "cost_micro_avg": [
                {"currency": "USD", "value": 1335},
                {"currency": "EUR", "value": 1230}
            ],
            "cost_micro_p80": [
                {"currency": "USD", "value": 2040},
                {"currency": "EUR", "value": 1879}
            ],
            "response_time_sec_avg": "5.49",
            "response_time_sec_p80": "6.40",
            "status_codes": [
                {
                    "code": null,
                    "count": 3
                },
                {
                    "code": 200,
                    "count": 432
                },
                {
                    "code": 404,
                    "count": 3
                }
            ]
        }
    ],
    "total_result_count": 1
}
Each entry of a cost_micro_* array has a currency field, a three-letter
ISO 4217 currency code, and a
value field. As with the cost_microusd_* fields of /api/stats, the
value is expressed in micro-units of the currency: divide it by 1,000,000 to get
the amount in the main unit of the currency. For example, a value of
584773 for USD is 0.58 USD.
Only the currencies present in your usage during the selected timeframe are included; a currency you did not use is omitted, not reported as zero.
When domain health information is requested (include_domain_health=true), its
monetary fields follow the same per-currency format, named total_spent_micro_*
and my_avg_price_micro_* (instead of the *_microusd_* fields of
/api/stats).
Billed traffic
Both /api/stats and the multicurrency endpoint
include a billed_traffic_bytes field in each result: the total billed traffic
in bytes over the selected timeframe, and per domain when groupby_domain=true.
It is a plain integer total, not broken down by currency.
It is non-zero only for requests that trigger per-GB billing, such as those using
ipType:residential
or extended geolocations; it is 0 otherwise.
Rate limiting
The stats API has a rate limit of 20 requests per minute. Anything above that will trigger a 429 response.
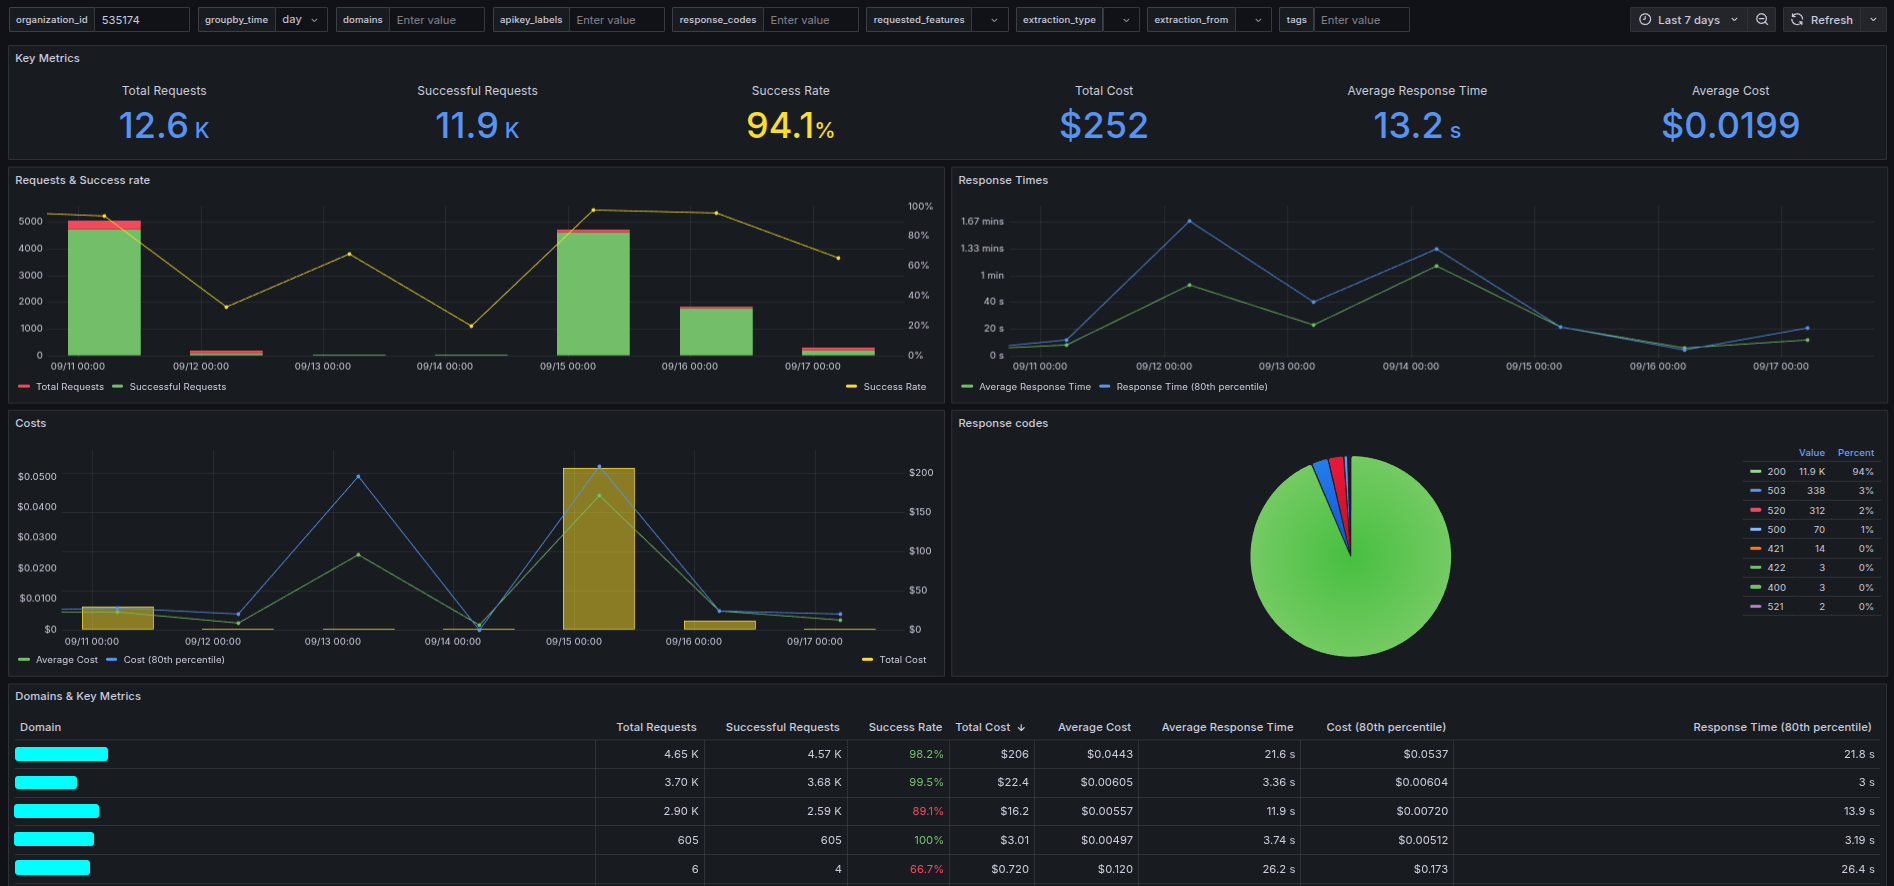
Grafana dashboard
Follow the steps below to replicate the shown Grafana dashboard to visualize data from the stats API.
First, install the Infinity plugin on your Grafana instance.
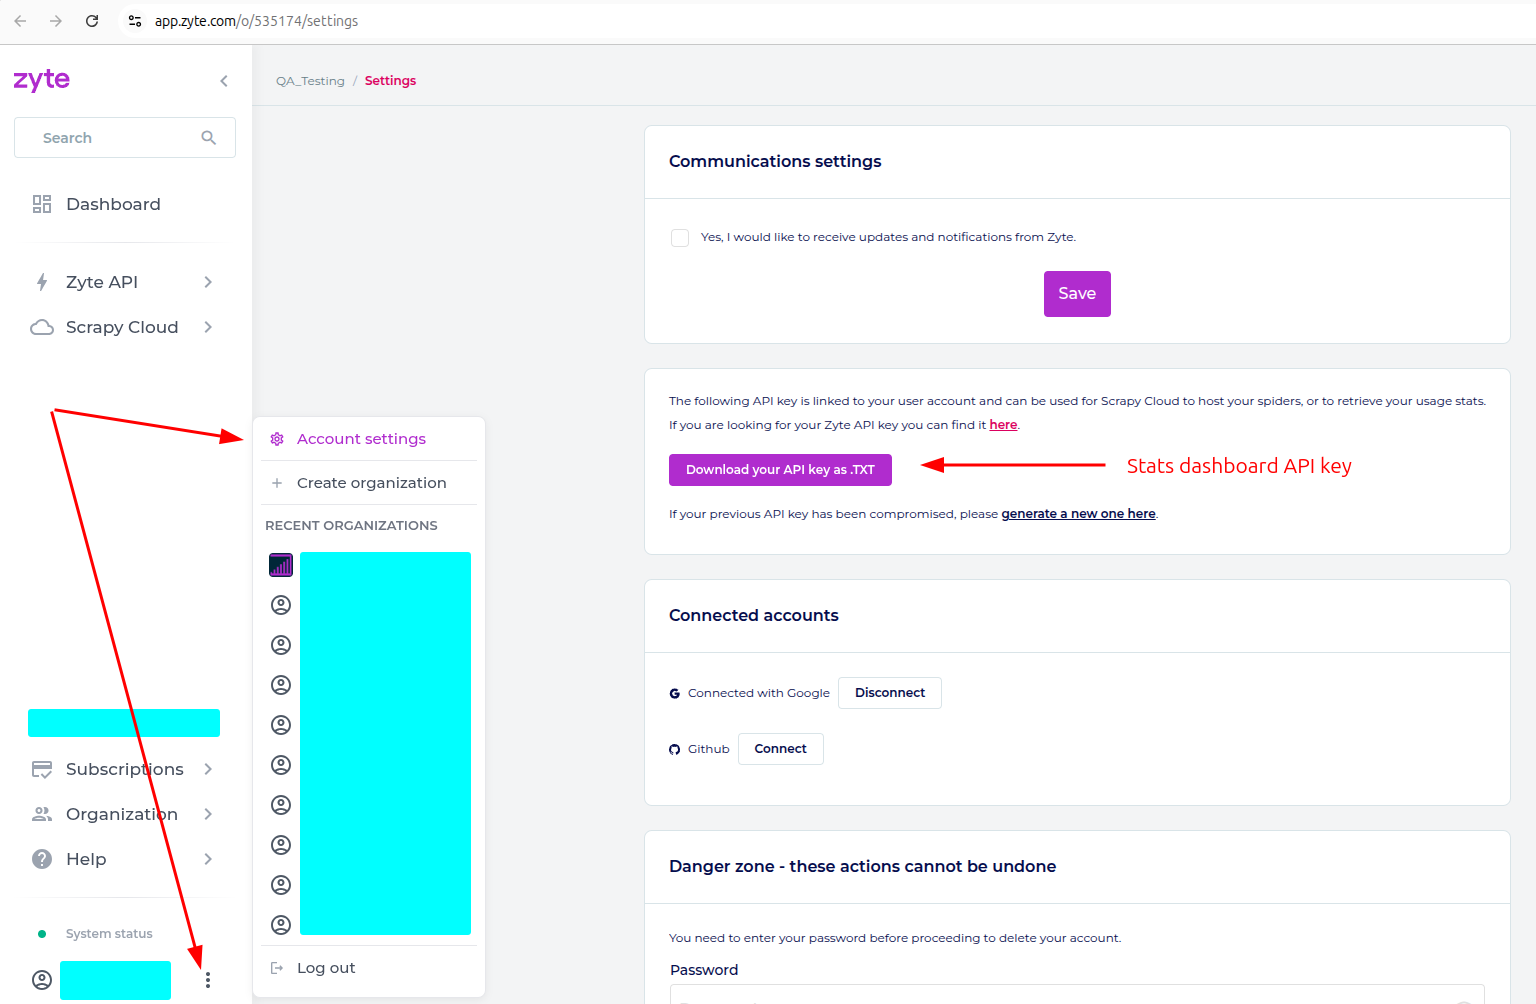
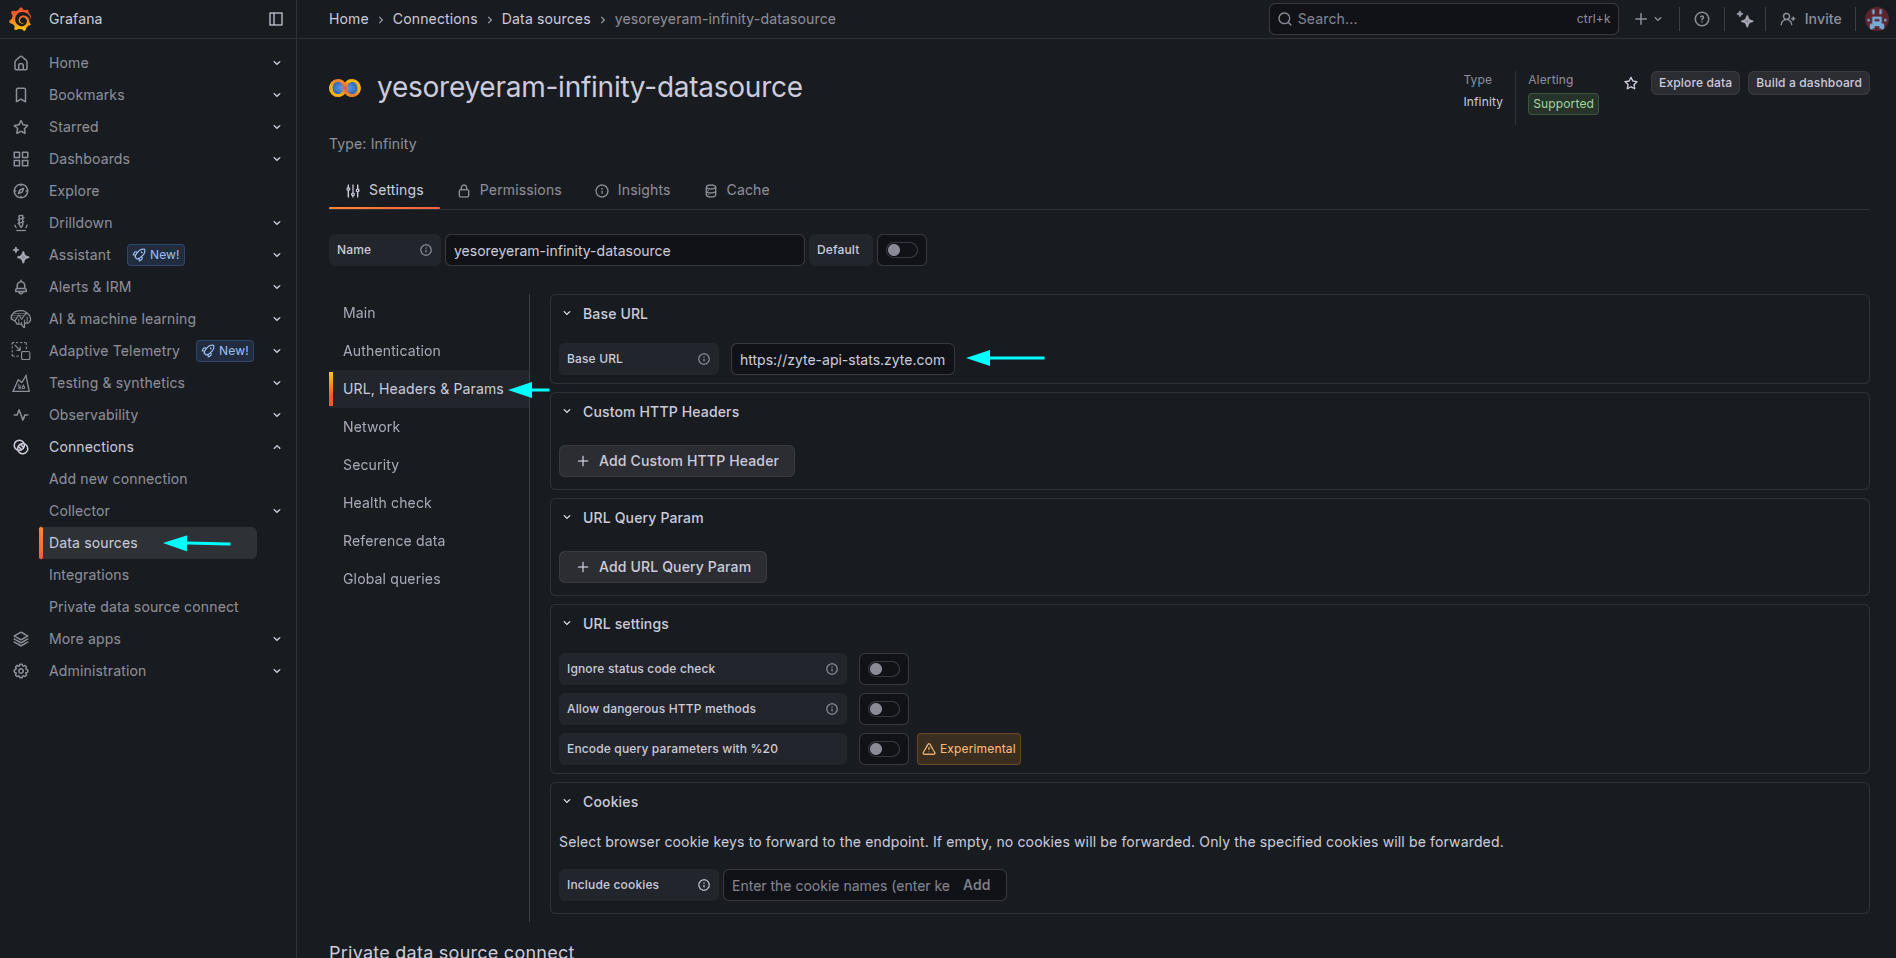
Add the newly installed data source into the Data Sources section and configure it to fetch data from https://zyte-api-stats.zyte.com with your Stats dashboard API key.
Impot the dashboard from the file stats_api_demo.json.
Paste your organization ID into the “organization_id” field as shown in the screenshot below.
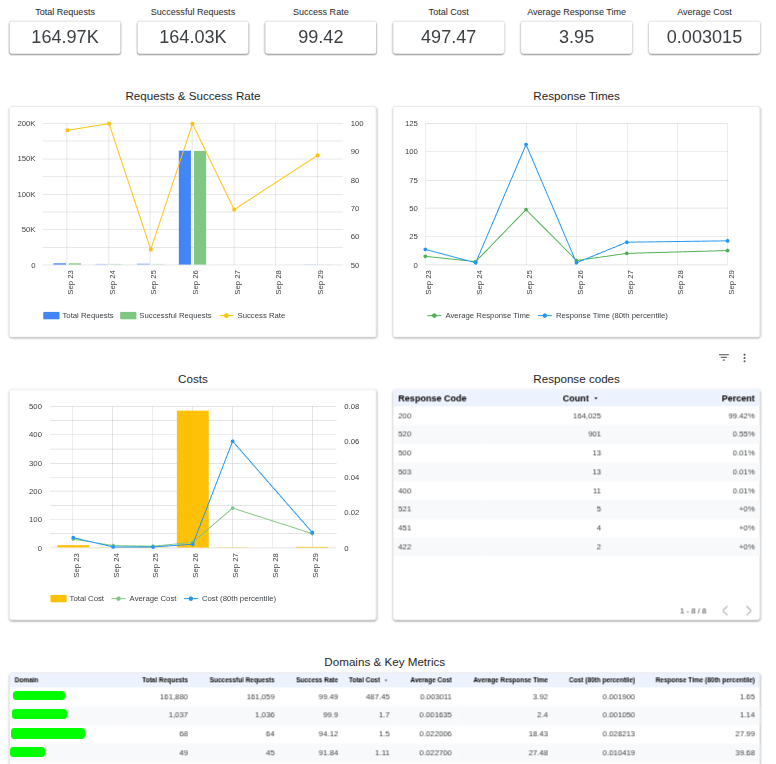
Google Looker Studio dashboard
Follow the steps below to replicate the shown Google Looker Studio dashboard to visualize data from the stats API.
First, connect to the Zyte API Stats Connector.
It will ask for the API key - provide your your Stats dashboard API key (not your Zyte API key).
Check all of the “Allow … to be modified in reports.” checkboxes.
Paste your organization ID into the “organization_id” parameter.
Click the “Connect”, “Allow”, “Create report” and “Create report” buttons.
Reference
APIFlask (0.1.0)
Download OpenAPI specification:Download
Stats
Authorizations:
query Parameters
| organization_id required | integer |
| page | integer >= 1 Default: 1 |
| page_size | integer [ 1 .. 500 ] Default: 500 |
| start_time | string <date-time> The start date and time in
ISO 8601-1 format (e.g. It defaults to 7 days in the past. |
| end_time | string <date-time> The end date and time in
ISO 8601-1 format (e.g. It defaults to the current date and time. |
| domains | string [ 0 .. 64 ] characters |
| apikey_labels | string [ 0 .. 64 ] characters |
| response_codes | string [ 0 .. 64 ] characters |
| requested_features | any Enum: "actions" "browserHtml" "fileDownload" "httpResponseBody" "networkCapture" "screenshot" "sessionContext" "extendedGeolocation" |
| extraction_type | any Enum: "article" "articleList" "articleNavigation" "forumThread" "jobPosting" "jobPostingNavigation" "pageContent" "product" "productList" "productNavigation" "serp" |
| extraction_from | any Enum: "httpResponseBody" "browserHtml" |
| tags | string [ 0 .. 64 ] characters Filter requests by tags. It must be a comma-separated list of values, where each value can be:
Only requests that match all the specified tag filters will be included in the results. |
| groupby_time | string or null Default: null Enum: "hour" "day" "month" "year" null |
| groupby_domain | boolean Default: false Group results by domain. When set to |
| include_domain_health | boolean Default: false Include domain health information in the response. Requires |
Responses
Response Schema: application/json
| page required | integer >= 1 | ||||||||||||||||||||||||||||||||||||||||||||||||||||||||||||||||||||
| page_size required | integer [ 1 .. 500 ] | ||||||||||||||||||||||||||||||||||||||||||||||||||||||||||||||||||||
required | Array of objects (StatsResult) [ items ] | ||||||||||||||||||||||||||||||||||||||||||||||||||||||||||||||||||||
Array
| |||||||||||||||||||||||||||||||||||||||||||||||||||||||||||||||||||||
| total_result_count required | integer >= 1 | ||||||||||||||||||||||||||||||||||||||||||||||||||||||||||||||||||||
Response samples
- 200
- 401
- 422
{- "page": 1,
- "page_size": 1,
- "results": [
- {
- "billed_traffic_bytes": 0,
- "cost_microusd_avg": 0,
- "cost_microusd_p80": 0,
- "cost_microusd_total": 0,
- "day": "2019-08-24T14:15:22Z",
- "domain": "string",
- "domain_health": {
- "global_avg_success_rate_24h": "string",
- "global_avg_success_rate_7d": "string",
- "my_avg_price_microusd_24h": "string",
- "my_avg_price_microusd_7d": "string",
- "my_avg_response_time_24h": "string",
- "my_avg_response_time_7d": "string",
- "my_requests_24h": 0,
- "my_requests_7d": 0,
- "my_success_rate_24h": "string",
- "my_success_rate_7d": "string",
- "status": "healthy",
- "total_spent_microusd_24h": "string",
- "total_spent_microusd_7d": "string",
- "total_successful_requests_24h": 0,
- "total_successful_requests_7d": 0
}, - "hour": "2019-08-24T14:15:22Z",
- "month": "2019-08-24T14:15:22Z",
- "organization_id": 0,
- "request_count": 1,
- "response_time_sec_avg": 0,
- "response_time_sec_p80": 0,
- "status_codes": [
- {
- "code": 0,
- "count": 0
}
], - "year": "2019-08-24T14:15:22Z"
}
], - "total_result_count": 1
}Stats V1
Same as Stats, but with multicurrency support.
Cost fields are returned as arrays with one entry per currency present in your usage (cost_micro_total, cost_micro_avg, cost_micro_p80), and an additional billed_traffic_bytes field is included.
Use this endpoint if your organization is billed in a currency other than USD; the Stats endpoint reports costs in USD only and rejects non-USD organizations.
Authorizations:
query Parameters
| organization_id required | integer |
| page | integer >= 1 Default: 1 |
| page_size | integer [ 1 .. 500 ] Default: 500 |
| start_time | string <date-time> The start date and time in
ISO 8601-1 format (e.g. It defaults to 7 days in the past. |
| end_time | string <date-time> The end date and time in
ISO 8601-1 format (e.g. It defaults to the current date and time. |
| domains | string [ 0 .. 64 ] characters |
| apikey_labels | string [ 0 .. 64 ] characters |
| response_codes | string [ 0 .. 64 ] characters |
| requested_features | any Enum: "actions" "browserHtml" "fileDownload" "httpResponseBody" "networkCapture" "screenshot" "sessionContext" "extendedGeolocation" |
| extraction_type | any Enum: "article" "articleList" "articleNavigation" "forumThread" "jobPosting" "jobPostingNavigation" "pageContent" "product" "productList" "productNavigation" "serp" |
| extraction_from | any Enum: "httpResponseBody" "browserHtml" |
| tags | string [ 0 .. 64 ] characters Filter requests by tags. It must be a comma-separated list of values, where each value can be:
Only requests that match all the specified tag filters will be included in the results. |
| groupby_time | string or null Default: null Enum: "hour" "day" "month" "year" null |
| groupby_domain | boolean Default: false Group results by domain. When set to |
| include_domain_health | boolean Default: false Include domain health information in the response. Requires |
Responses
Response Schema: application/json
| page required | integer >= 1 | ||||||||||||||||||||||||||||||||||||||||||||||||||||||||||||||||||||||||||||||||||||||||||||||||||||||||||||||
| page_size required | integer [ 1 .. 500 ] | ||||||||||||||||||||||||||||||||||||||||||||||||||||||||||||||||||||||||||||||||||||||||||||||||||||||||||||||
required | Array of objects (StatsResultV1) [ items ] | ||||||||||||||||||||||||||||||||||||||||||||||||||||||||||||||||||||||||||||||||||||||||||||||||||||||||||||||
Array
| |||||||||||||||||||||||||||||||||||||||||||||||||||||||||||||||||||||||||||||||||||||||||||||||||||||||||||||||
| total_result_count required | integer >= 0 | ||||||||||||||||||||||||||||||||||||||||||||||||||||||||||||||||||||||||||||||||||||||||||||||||||||||||||||||
Response samples
- 200
- 401
- 422
{- "page": 1,
- "page_size": 1,
- "results": [
- {
- "billed_traffic_bytes": 0,
- "cost_micro_avg": [
- {
- "currency": "str",
- "value": 0
}
], - "cost_micro_p80": [
- {
- "currency": "str",
- "value": 0
}
], - "cost_micro_total": [
- {
- "currency": "str",
- "value": 0
}
], - "day": "2019-08-24T14:15:22Z",
- "domain": "string",
- "domain_health": {
- "global_avg_success_rate_24h": "string",
- "global_avg_success_rate_7d": "string",
- "my_avg_price_micro_24h": [
- {
- "currency": "str",
- "value": 0
}
], - "my_avg_price_micro_7d": [
- {
- "currency": "str",
- "value": 0
}
], - "my_avg_response_time_24h": "string",
- "my_avg_response_time_7d": "string",
- "my_requests_24h": 0,
- "my_requests_7d": 0,
- "my_success_rate_24h": "string",
- "my_success_rate_7d": "string",
- "status": "healthy",
- "total_spent_micro_24h": [
- {
- "currency": "str",
- "value": 0
}
], - "total_spent_micro_7d": [
- {
- "currency": "str",
- "value": 0
}
], - "total_successful_requests_24h": 0,
- "total_successful_requests_7d": 0
}, - "hour": "2019-08-24T14:15:22Z",
- "month": "2019-08-24T14:15:22Z",
- "organization_id": 0,
- "request_count": 1,
- "response_time_sec_avg": 0,
- "response_time_sec_p80": 0,
- "status_codes": [
- {
- "code": 0,
- "count": 0
}
], - "year": "2019-08-24T14:15:22Z"
}
], - "total_result_count": 0
}